调试 MiniOB
开发环境搭建(本地调试, 适用 Linux 和 Mac) - MiniOB
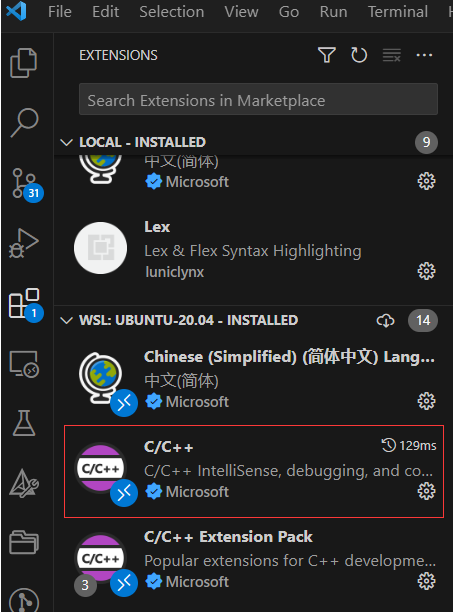
在 WSL 中安装 C++ 插件
创建 launch.json 文件
- 用 VSCode 打开 MiniOB 工作目录
- 在工程目录的 .vscode 目录下新建 tasks.json,鼠标右键 .VSCode 目录,选择新建文件,命名为 tasks.json
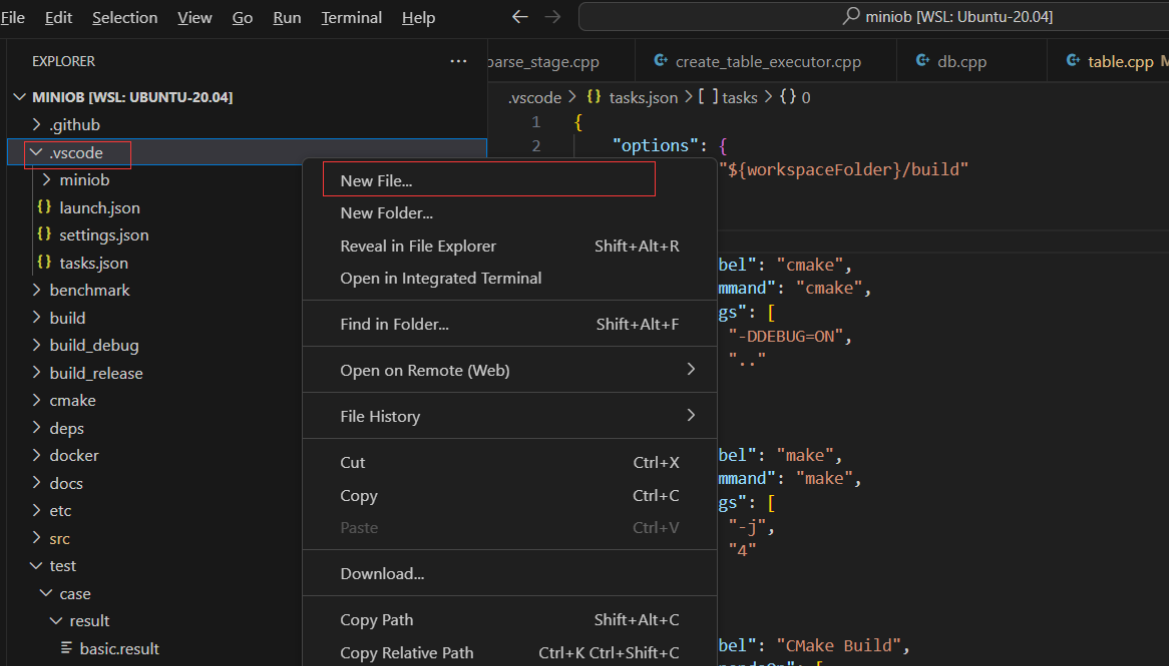
将以下内容复制到新创建的tasks.json文件中(如果新创建的文件中有内容,就先全部删除掉)。
{
    // 使用 IntelliSense 了解相关属性。
    // 悬停以查看现有属性的描述。
    // 欲了解更多信息,请访问: https://go.microsoft.com/fwlink/?linkid=830387
    "version": "0.2.0",
    "configurations": [
        {
            "name": "(gdb) attach",
            "type": "cppdbg",
            "request": "attach",
            "program": "${workspaceFolder}/build_debug/bin/observer",
            "processId":"${command:pickProcess}",
            "MIMode": "gdb",
            "setupCommands": [
                {
                    "description": "为 gdb 启用整齐打印",
                    "text": "-enable-pretty-printing",
                    "ignoreFailures": true
                },
                {
                    "description":  "将反汇编风格设置为 Intel",
                    "text": "-gdb-set disassembly-flavor intel",
                    "ignoreFailures": true
                }
            ]
        }
    ]
}
注意:
- program:该选项指编译出来的可执行文件的路径,本文中路径为"${workspaceFolder}/build_debug/bin/observer",之所以于官方文档不同,是因为使用命令bash build.sh编译项目时,会生成 debug 版的 MiniOB,源文件会存储在 build_debug 目录下。
- request:该选项用于指定调试器连接到正在运行的目标程序的方式。
- "request": "attach" 选项表示调试器将手动连接到正在运行的目标程序,而不是在启动时自动连接。这种方式适用于已经在运行的程序,或者需要手动触发调试器连接的情况。
开始调试工作
因为我们选择attach方式进行调试,所以要先编译 MiniOB,并启动它
- 进入工程目录,执行
bash build.sh - 上述build命令会生成build_debug目录,进入该目录,执行命令
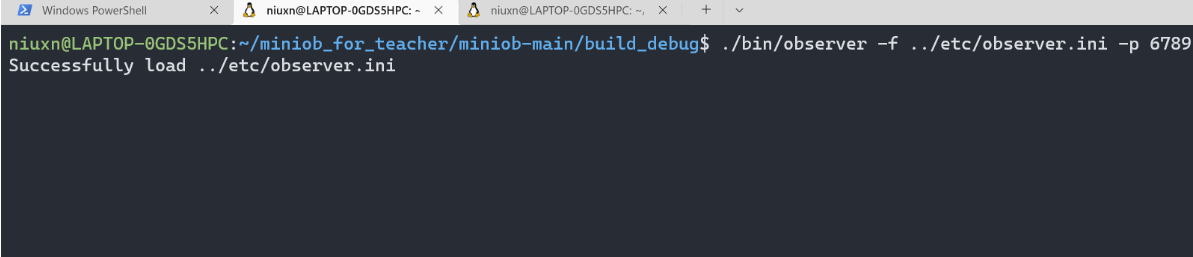
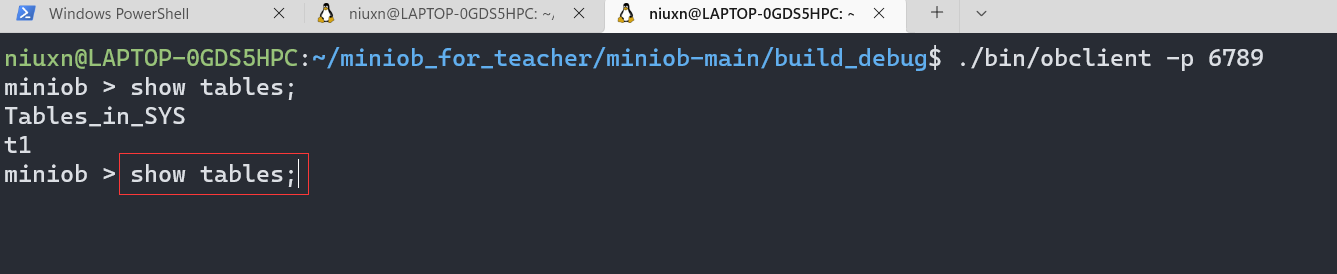
./bin/observer -f ../etc/observer.ini -p 6789,这会以监听6789端口的方式启动服务端程序。 - 打开一个新的标签页,进入到build_debug,启动客户端程序:
./bin/obclient -p 6789
启动服务:
启动客户端:
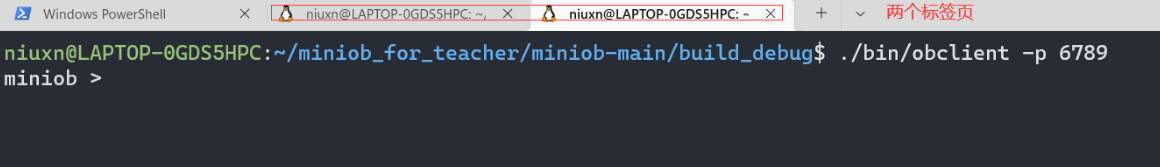
此时,服务器启动成功。
接下来我们调试一下show tables;这条sql。
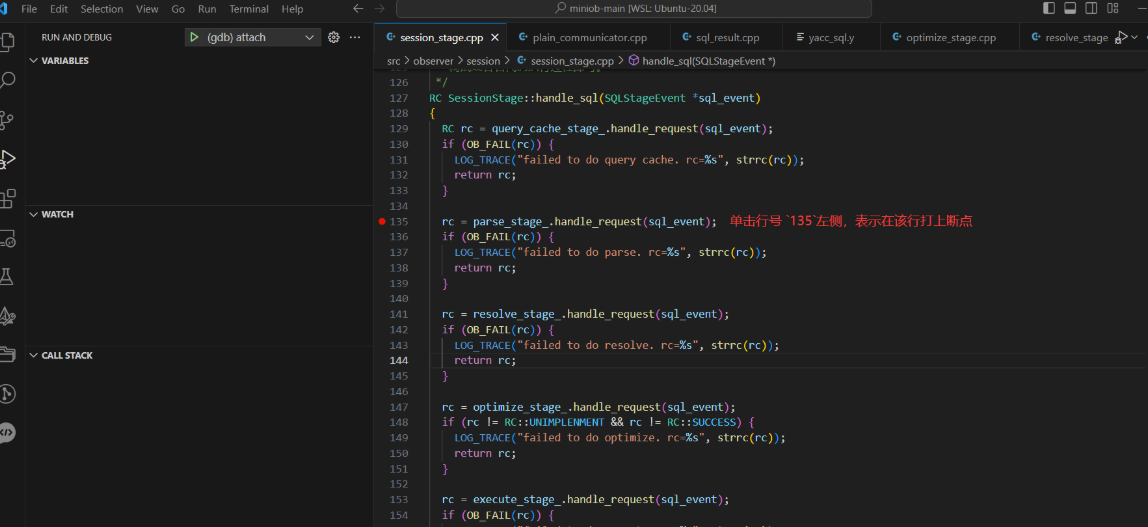
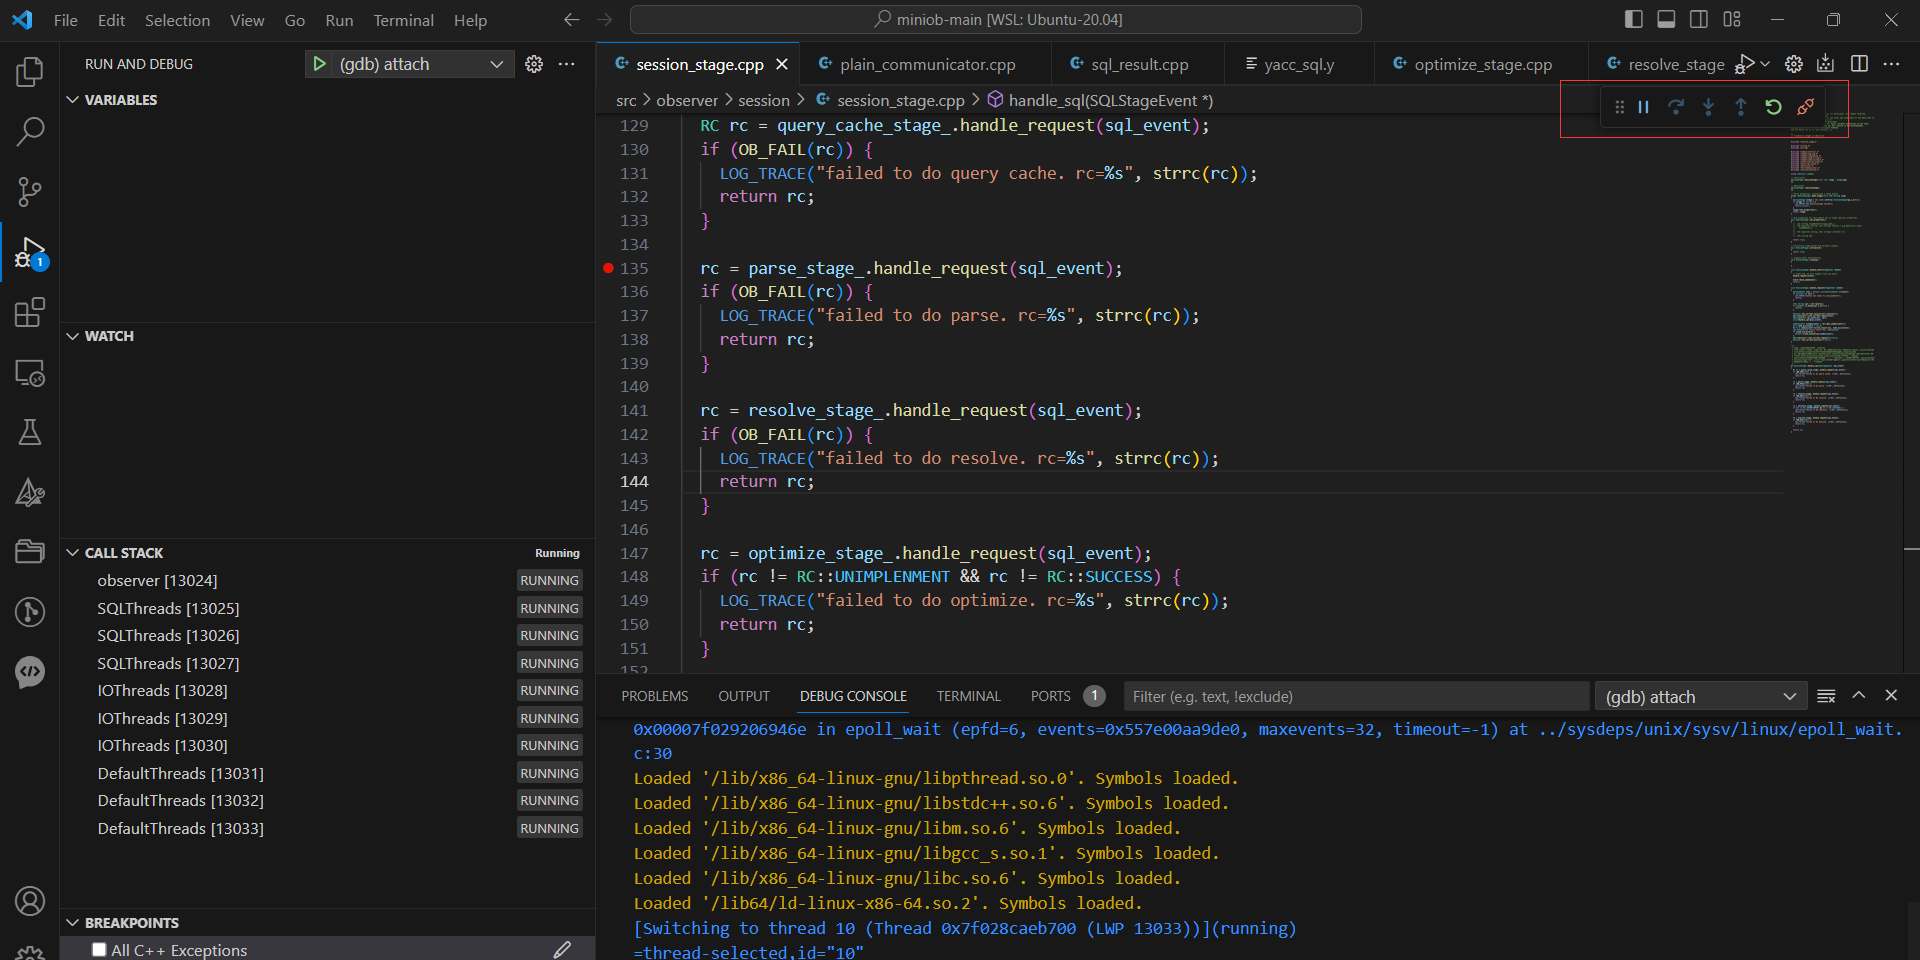
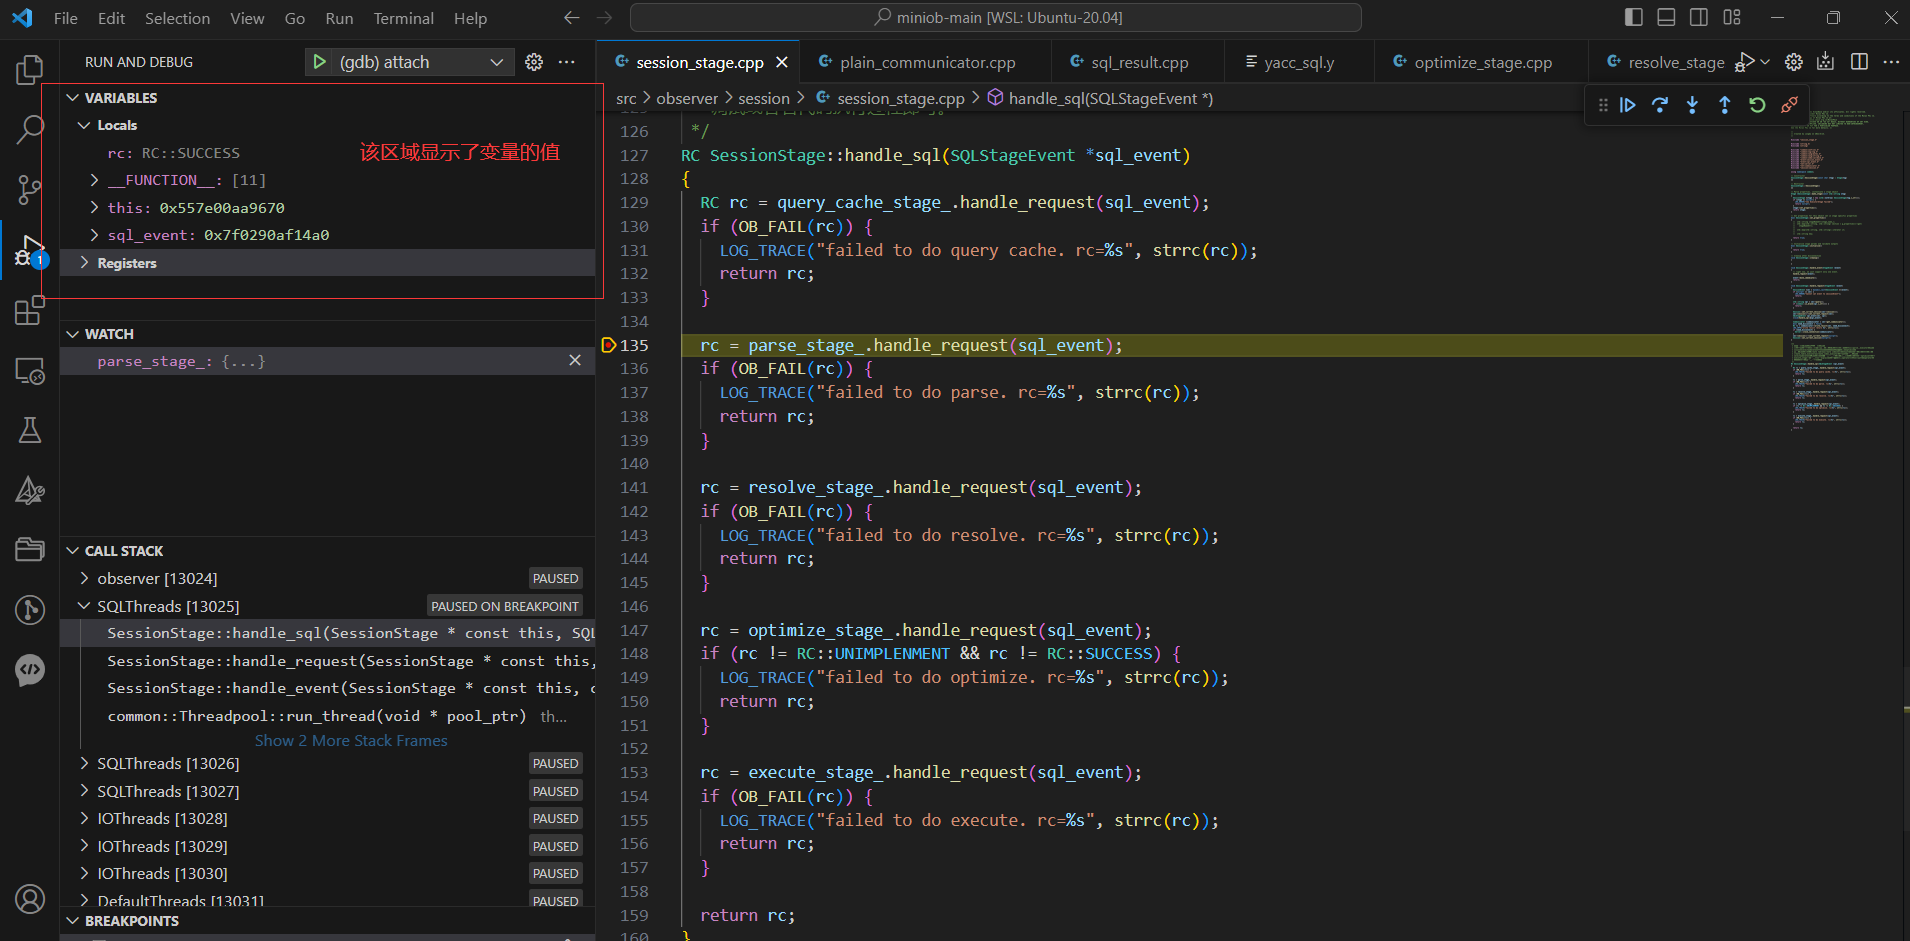
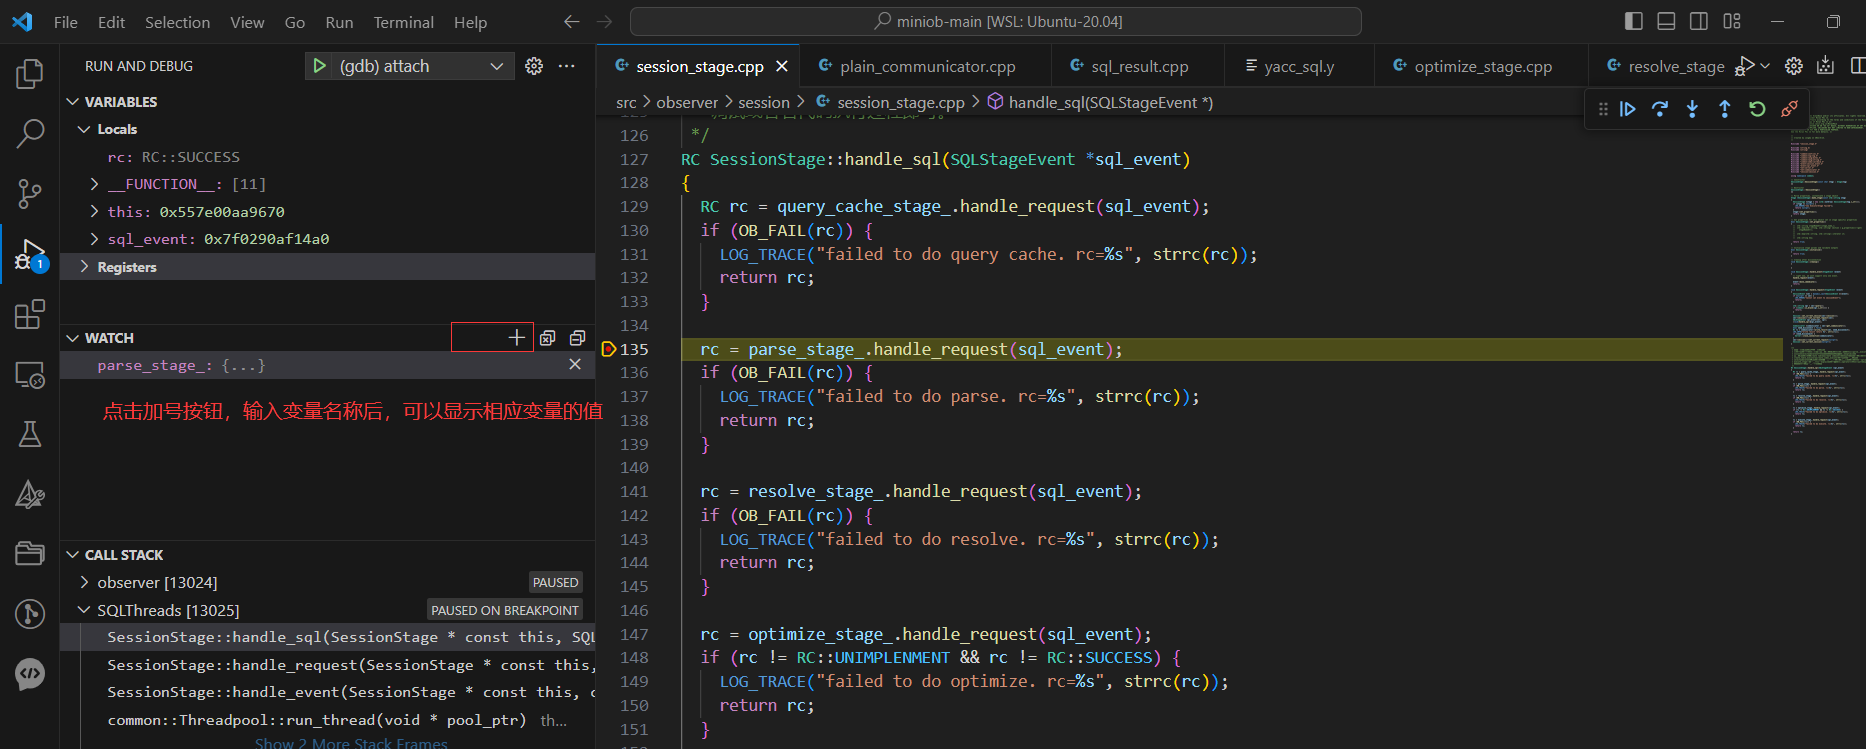
将桌面切换回vscode,可以先将断点打在session_stage.cpp文件的135行处,如下图所示。
点击左侧菜单栏的run and debug(图标为一只虫子)按钮。
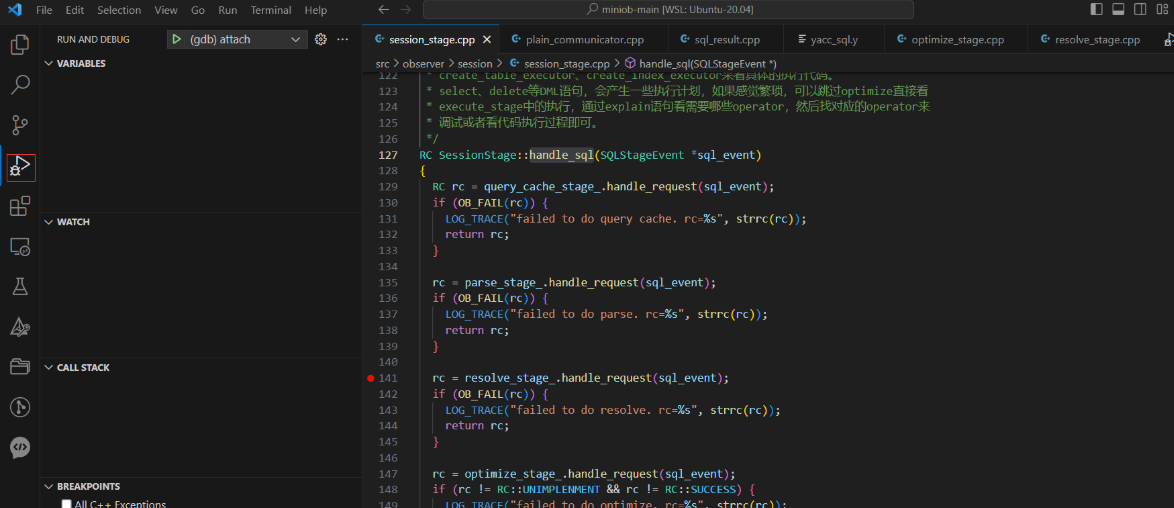
接着启动调试,按照下图所示。
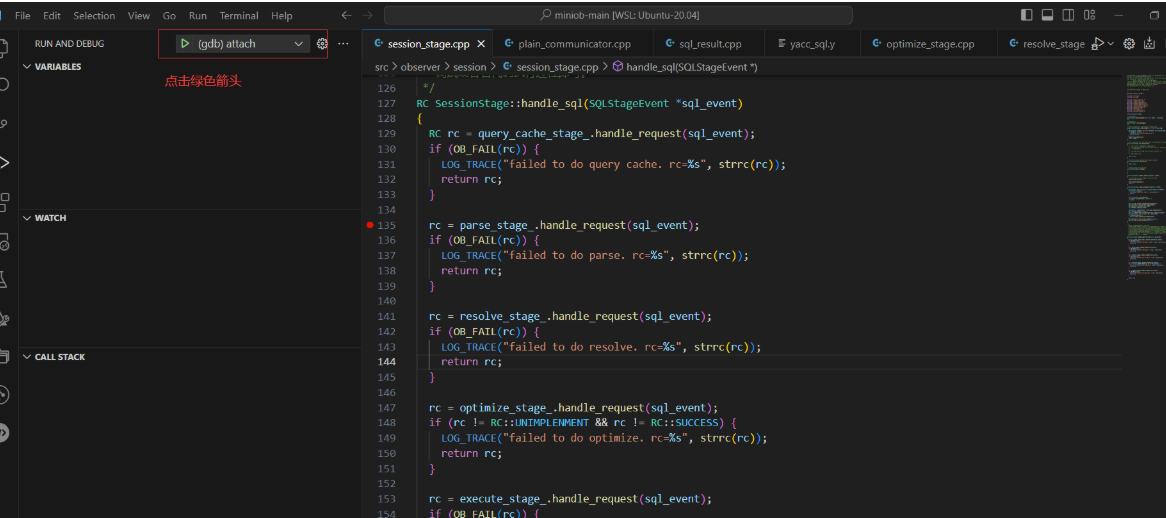
点击箭头后会弹出一个窗口,在其中输入 observer,表示我们要attach到observer这个程序上。
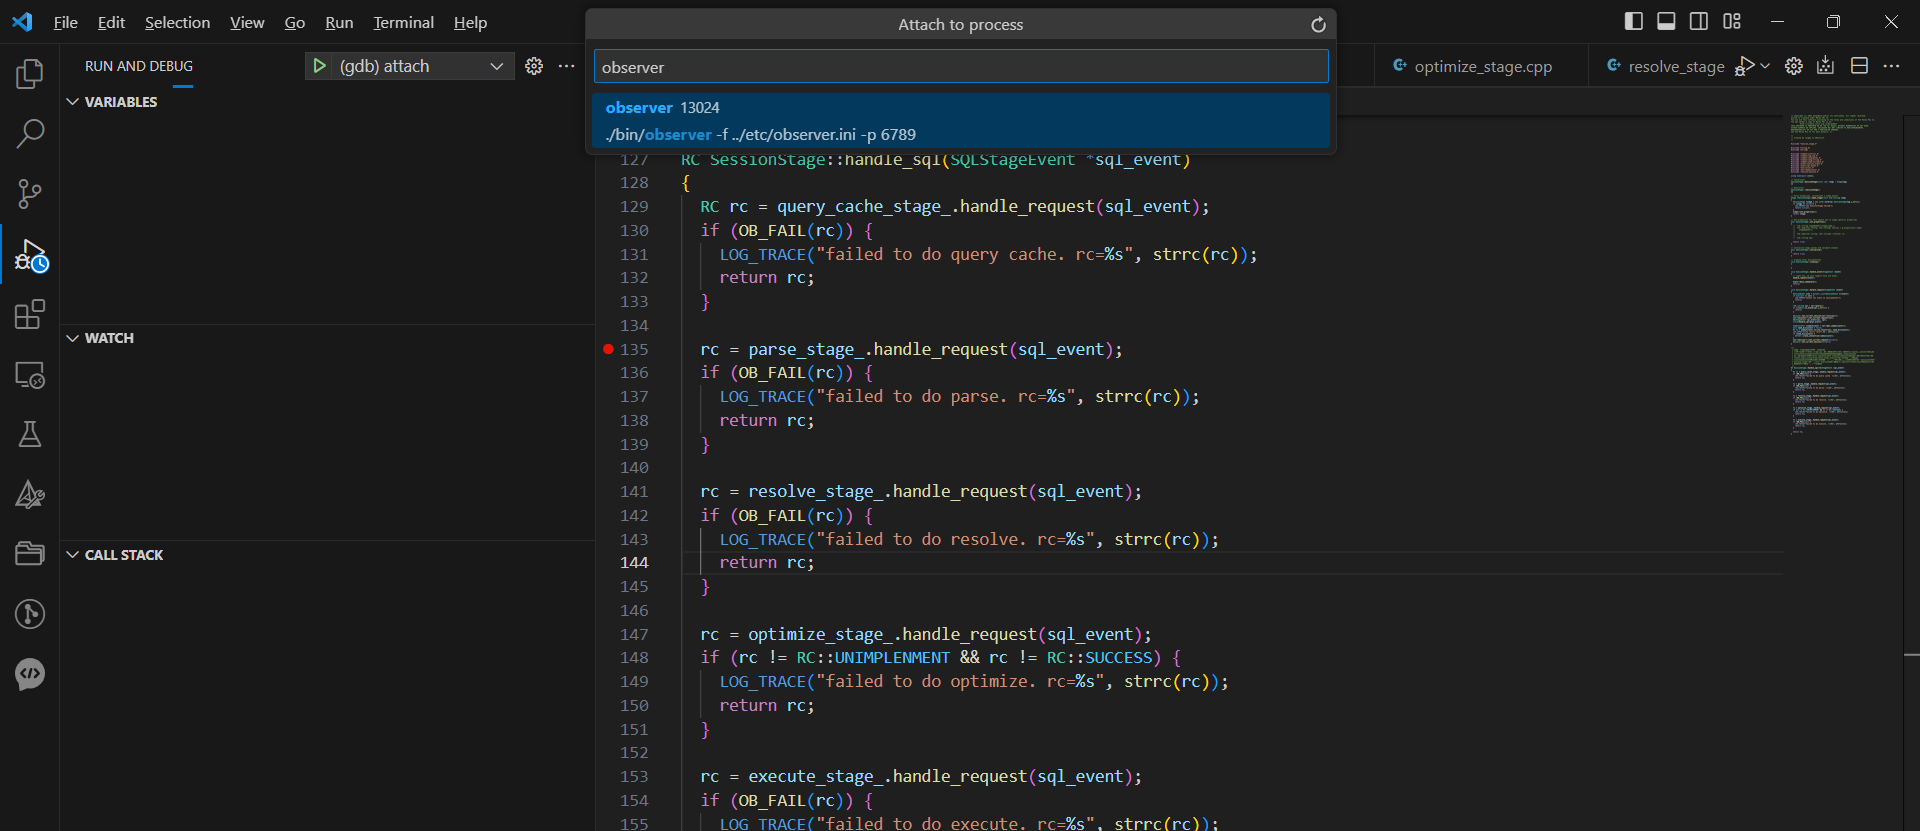
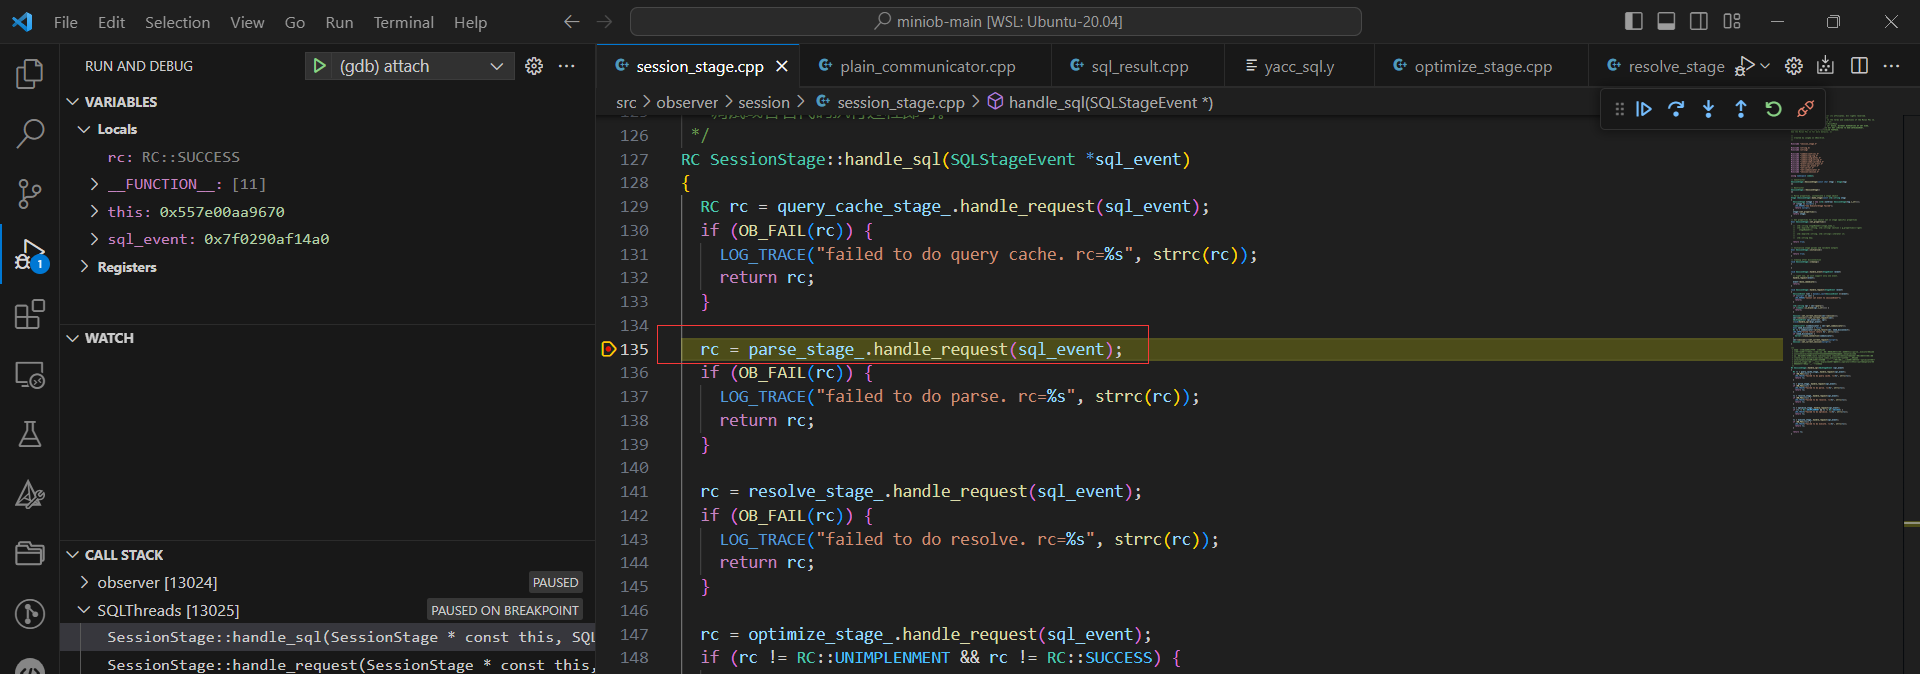
之后,如果出现下图中框中的内容,则表示一切顺利.
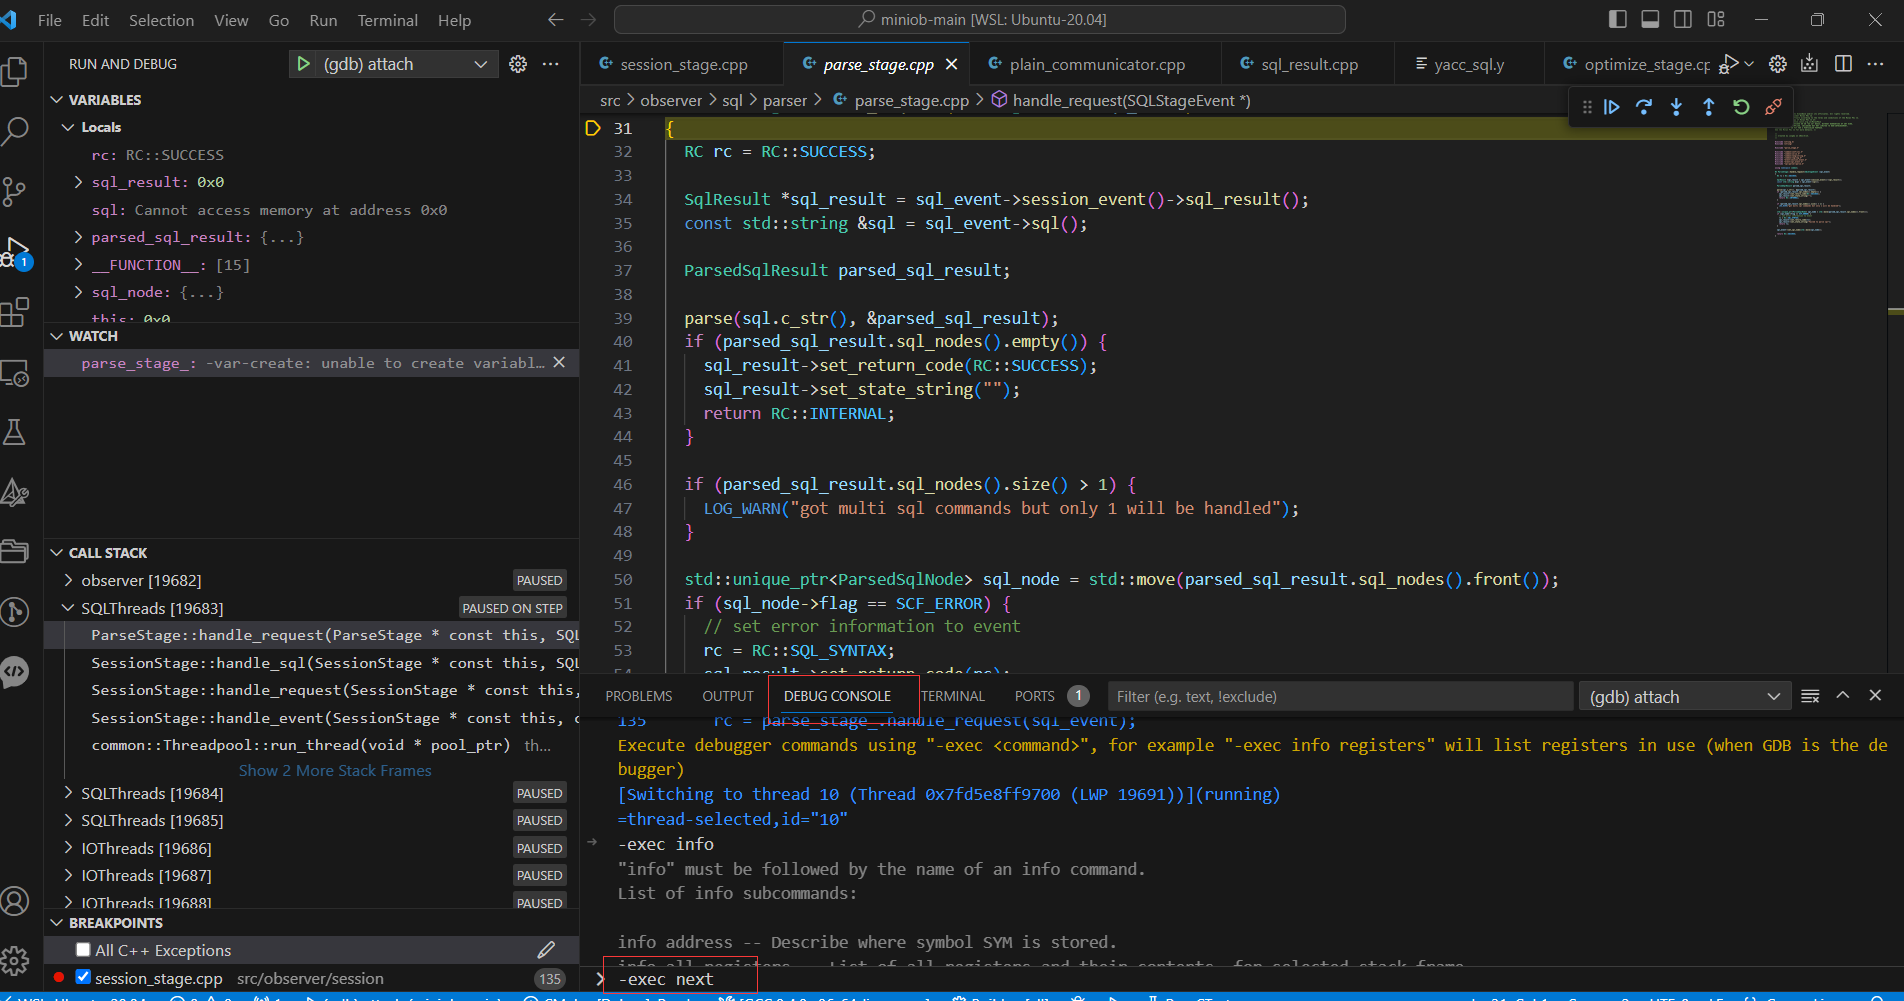
接下来在客户端输入要调试的sql
程序会命中之前打的断点
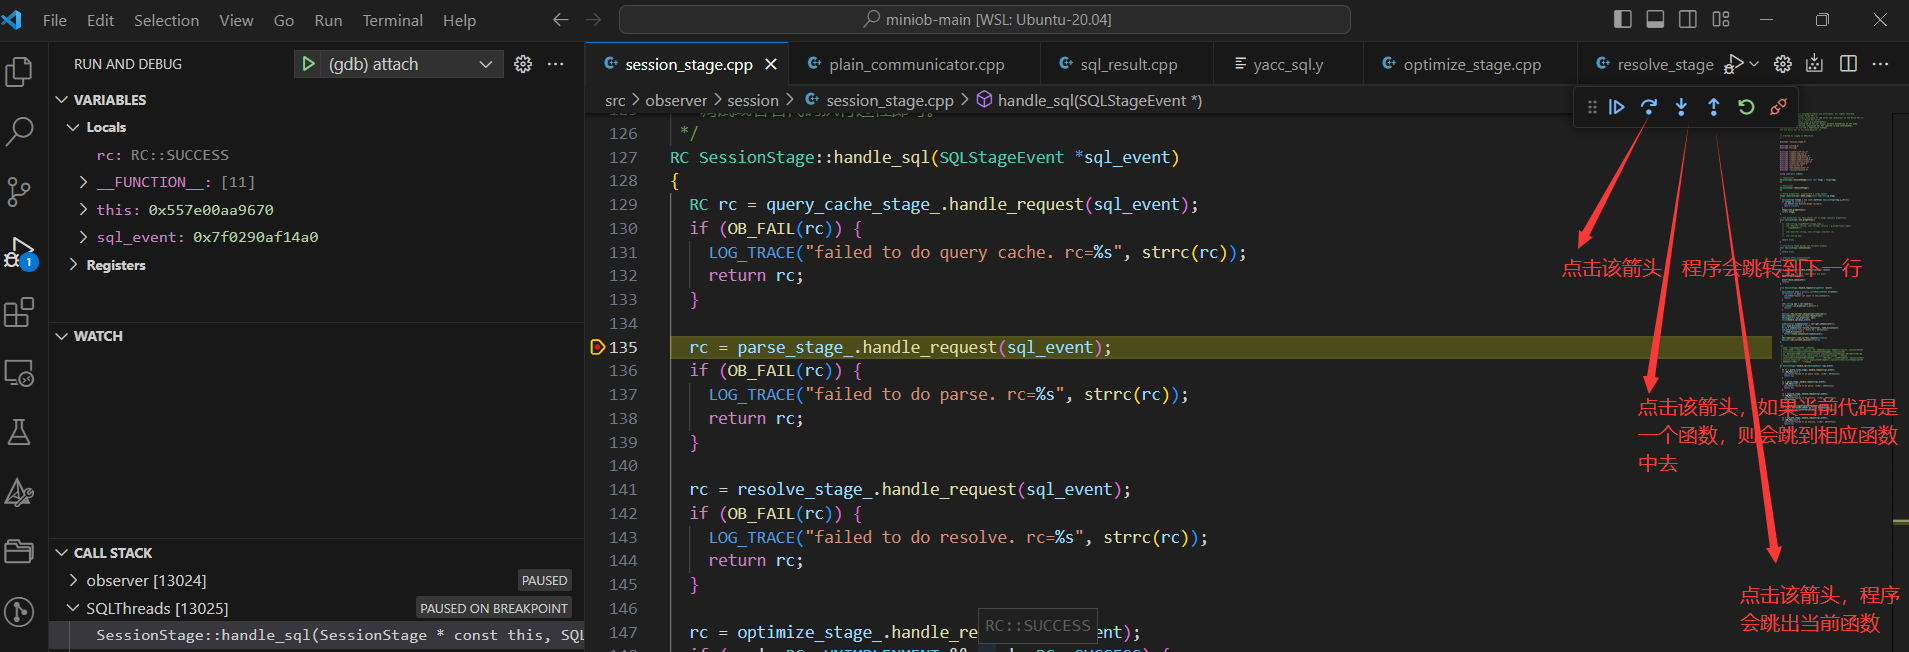
下图中是一些说明,大家可以试一试体会一下各个按钮的作用
如何查看当前变量的值呢?
常用的gdb命令
如何在vscode中使用这些命令呢?
在debug console中,要在命令前添加 -exec 如果我们要使用next命令,则需要在debug console 中输入-exec next
调试 core 文件
当程序发生段错误挂掉时(空指针,野指针,堆栈溢出,double free等),系统会生成相应的core文件。core文件就是用来帮助我们找到是哪里发生了段错误的。
首先,我们需要修改一些配置,使得发生段错误时,系统可以为我们生成core文件。
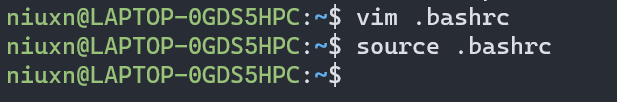
使用vim命令,在家目录下的.bashrc文件中添加一条命令: ulimit -c unlimited
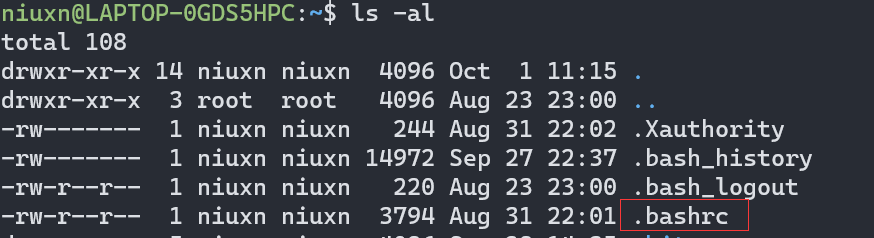
在文件的最后一行增加命令ulimit -c unlimited
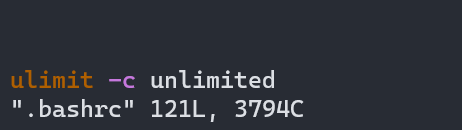
执行 source .bashrc命令使修改生效。
core 文件位于 build_debug 目录下,要调试 core 文件,需要进入到该目录,使用命令 gdb bin/observer core
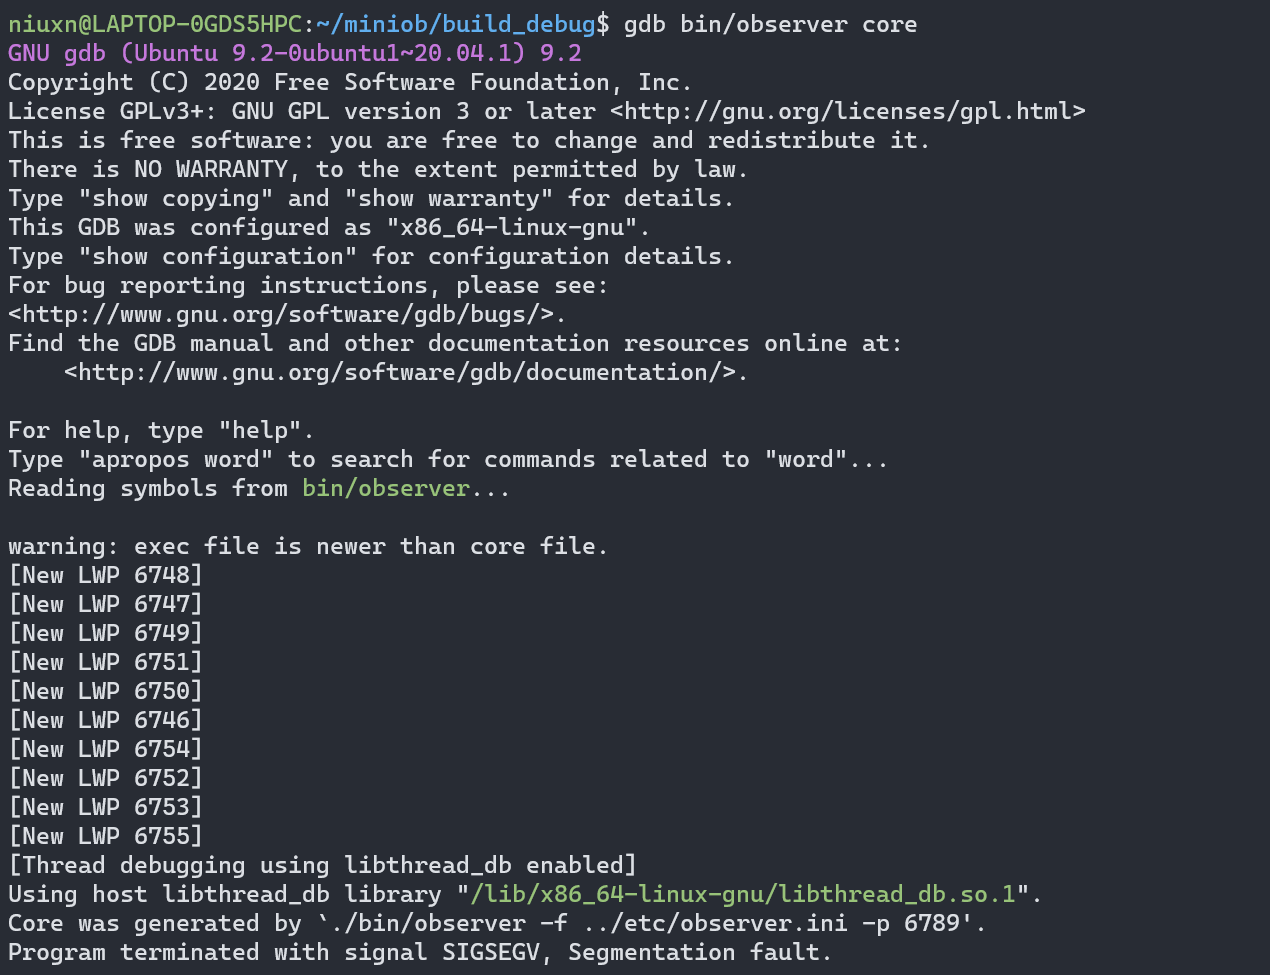
这样我们就可以使用 gdb 命令来调试 core 文件了。 可以输入 bt 命令,查看当前的调用堆栈,位于调用堆栈最上方的函数,即是发生段错误的位置。